See the structure, then implement and verify with the notes.

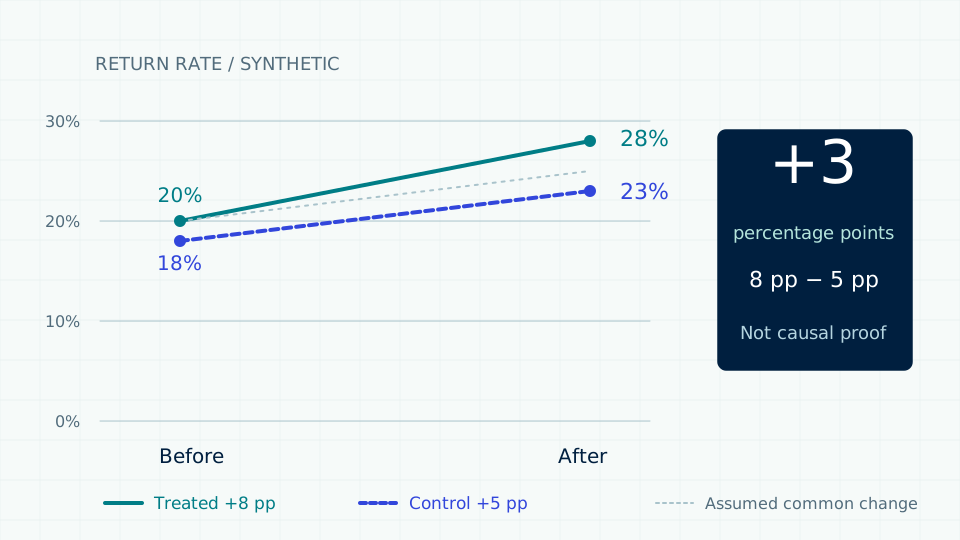
Synthetic arithmetic: treated +8 pp, control +5 pp, difference +3 pp. Four points do not establish causality or uncertainty.
What situation are you walking into?
Repeat purchase rose alongside a holiday campaign and price changes. Finance asks how much the system caused. A polished growth chart cannot answer that alone.
01 / Three evidence layers are not interchangeable
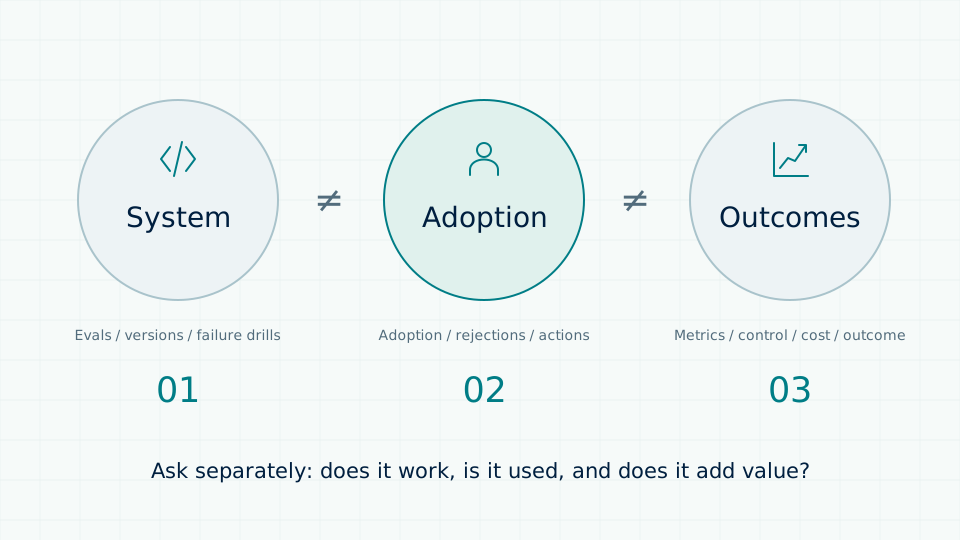
System evidence covers quality, authority and reliability; behavior covers use, edits, rejections and execution; business evidence covers agreed outcomes. Good quality with low adoption suggests workflow problems. Adoption without outcomes calls for testing assumptions and observation windows.
02 / Design attribution before calculating it
Prefer randomized controlled pilots when feasible. Otherwise document comparison selection and assumptions. Difference-in-differences compares changes but requires a credible counterfactual, no contamination and relevant trend assumptions. Non-significant pre-trends do not prove validity; small samples and staggered rollout need care.
03 / Released hours are not automatically cash savings
Measure task-time distributions and frequency before valuing released capacity. Revenue contribution needs discounts, fulfillment, returns and acquisition cost adjustments. Avoid double-counting overlapping initiatives. Separate observed benefits, attributable benefits and commercial payment outcomes.
04 / Outcome-linked acceptance needs shared boundaries
An acceptance pack includes scope, versions, tests, usage, analysis, unmet items and next actions. Outcome-linked agreements require definitions, data access, responsibilities, external-factor handling and dispute limits. The source course’s Outcome-Level Agreement is not a standard acronym; IT service OLA commonly means Operational Level Agreement.
Put the method to work
Synthetic data: treatment moves 20% to 28%; comparison moves 18% to 23%. The raw change is eight points; DiD is (28−20)−(23−18)=three points. A causal interpretation needs credible assumptions, and statistical significance is not established by this arithmetic.
Practice this week
- Complete three-layer acceptance evidence with unmet items.
- Reproduce before/after and comparison calculations with assumptions.
- Rehearse reporting inconclusive results and propose the next test.
Acceptance checks
- Percentage points and percent changes are distinct.
- Correlation, adoption and prediction are not presented as causation.
- Unmet targets and shared conditions are disclosed.
90 minutes: write a defensible value report
Synthetic treatment retention rises from 20% to 28%; comparison rises from 18% to 23%. Separate observations from identification assumptions. Two time points cannot test pre-intervention parallel trends.
0–20 min: define eligibility, windows and contamination: simultaneous promotions, price changes, attrition and cross-store spillovers.
20–55 min: calculate changes and DiD. Judge whether causal interpretation is justified; propose history or an alternative design if necessary.
55–90 min: build an acceptance index separating system quality, usage, outcomes and unmet conditions. Authorized parties confirm commercial decisions.
Artifact excerpt · synthetic example
Observed: treatment +8 pp; comparison +5 pp
Arithmetic difference: 8 - 5 = 3 percentage points
Not: 3% revenue growth or a threefold improvement
Assumptions: parallel trends, no differential shocks, stable composition
Missing: pre-trends, sample size, clustering and uncertainty
Report: a teaching calculation, not demonstrated causal impact
Instructor review
Separate controllable actions from external conditions. Do not conflate SLAs, outcome metrics and payment terms. Define the course-specific OLA usage and obtain professional contract review.
An unseen field challenge ↗
If the system meets acceptance but outcomes do not improve, specify evidence-based conditions for continuing, changing course or stopping.
Case studies for this module
The three evidence classes are related, not interchangeable. Frequent use is not causal uplift, and growth does not waive safety.
Treatment gains 8 points; comparison gains 5. What is DiD?
Three percentage points is not a 3% relative increase and does not establish statistical significance.
References and further reading
World Bank DIME ↗ · Difference-in-Differences2023-08-07 · World Bank DIMEWorld Bank ↗ · What to do about parallel trends when you only have baseline data?2023 · World Bank神策数据 / Sensors Data ↗ · 从卖工具到卖效果:RaaS 如何重塑 ToB 市场格局?2025-10-29 · 神策数据 / Sensors DataRead alongside the assignment and record design constraints and tests. Verify specifications against your deployment version.